
Performance & Trends
Track fitness, fatigue, personal bests, and long-term performance trends in Coach Watts.
The Performance page shows how your fitness evolves over time. It combines training stress metrics with personal records and trend analysis.
Training stress chart
The core chart displays three curves:
| Metric | Window | Meaning |
|---|---|---|
| CTL (Fitness) | 42-day rolling average | Long-term training capacity |
| ATL (Fatigue) | 7-day rolling average | Short-term training stress |
| TSB (Form) | CTL − ATL | Readiness — positive often means fresh |
Use TSB to gauge race readiness: deeply negative TSB suggests accumulated fatigue; positive TSB suggests you are fresh (but possibly detrained if sustained too long).
See Metrics & Scoring for calculation details.
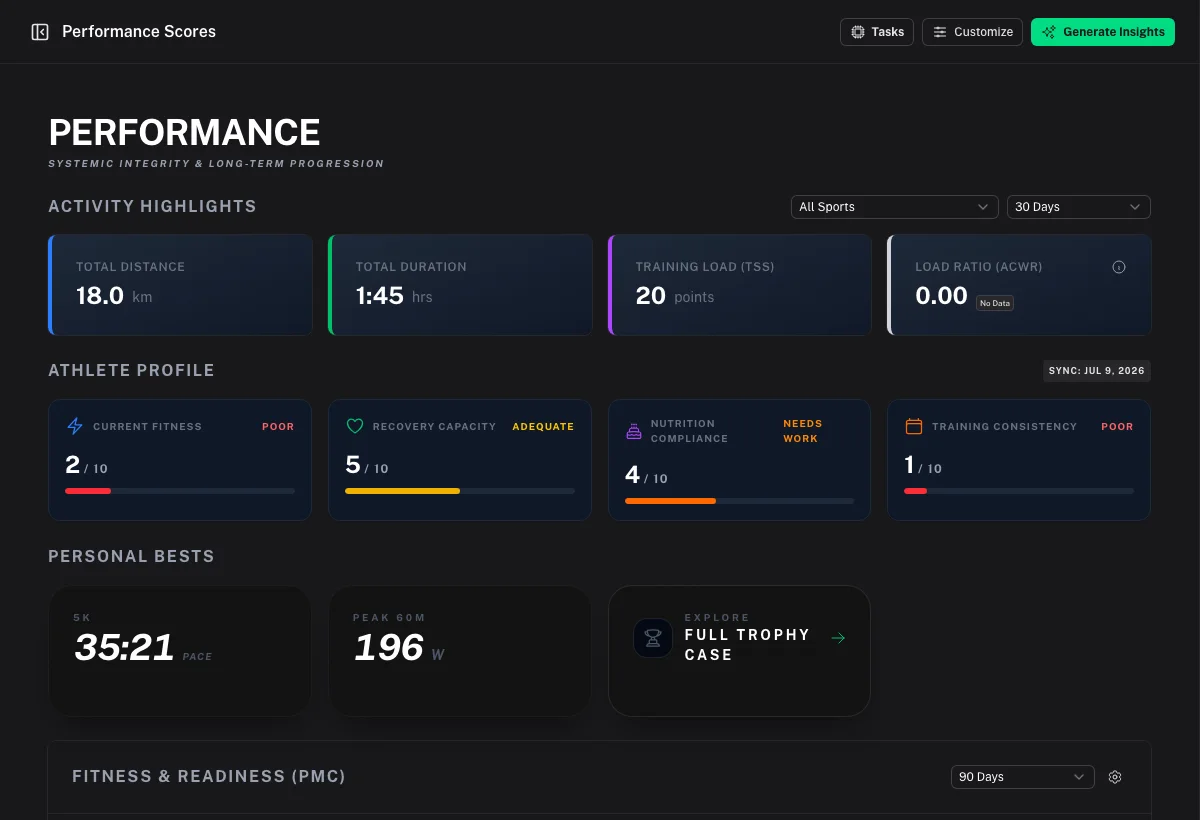
Personal bests
Performance → Bests tracks records across distances and durations:
- Peak power outputs (5s, 1min, 5min, 20min, 60min)
- Best pace at standard distances
- Seasonal and all-time records
Bests update automatically as new workouts sync.
Fitness page
Fitness provides deeper analysis of your aerobic and anaerobic development:
- Power-duration curve
- Efficiency factor trends
- VO2 max estimates from connected devices
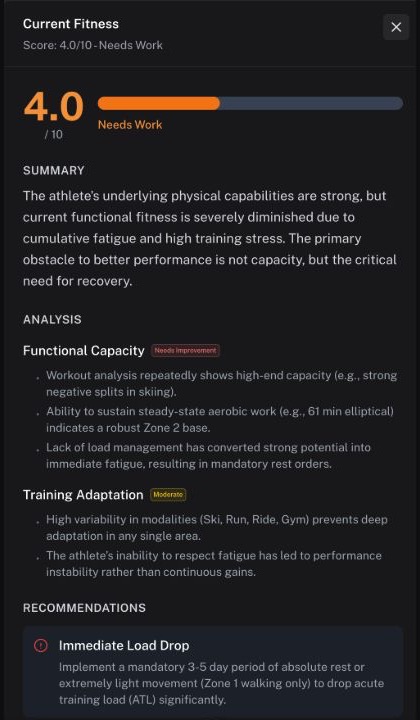
Open the score card when you want the context behind a change in fitness rather than relying on the trend line alone.
Analytics tools
Advanced analysis lives under Library → Charts and Analytics:
- Workout Comparison — compare two sessions side by side
- Workout Explorer — search and filter your history by type, zone, or metric
- Report Builder — custom charts for specific metrics over time
Using trends in coaching
Combine performance data with Chat for deeper insight:
- "Is my CTL trending up too fast?"
- "Compare my last two threshold sessions."
- "Am I on track for my goal event based on current fitness?"
Charts inventory
| Surface | What it answers |
|---|---|
| Performance stress chart | CTL / ATL / Form over time |
| Performance → Bests | Peak power and pace records |
| Fitness | Deeper aerobic/anaerobic context and score cards |
| Library → Charts / Analytics | Custom saved charts, explorer, and workout comparison |
| Workout detail | Intervals, zones, power curve, map for one session |
See Analytics Explorer & Workout Comparison for building and pinning charts.
Troubleshooting load charts
Form (TSB) looks “wrong”
Form is CTL − ATL. A hard training block drives Form negative; rest raises it. If numbers disagree with feel:
- Confirm recent workouts synced and duplicates are resolved (Duplicate Workouts).
- Check sport thresholds used for TSS (Sport Profiles).
- Remember CTL (~42 days) moves slowly; ATL (~7 days) moves quickly after a big weekend.
Fitness dropped after a rest week
Expected when ATL falls faster than CTL at first, then CTL eases if rest continues. Compare against your plan taper rather than day-to-day noise.
Bests missing a known PR
Open the source workout, confirm it is the primary version, and that power or pace streams imported. Re-sync the provider or re-analyze if streams were incomplete.